

The OMS model
The Online Mobilisation Score was briefly introduced in the first part of the report. In this part we provide the details for those interested in the statistical approach.
The OMS is based on the model of mobilisation developed through structural equation modelling built on a literature review and consultations with radicalisation and diaspora research experts and activists. In this section, we first discuss the model and its components.
OMS model in short
The Online Mobilisation Score measures the relative readiness of a person or a group to undertake a political action to address a specific issue of their concern, partially influenced by online content about the issue. The key elements of the model are action-readiness which goes beyond voting and sharing opinions online, the expressed perceived need for political, social, and economic change, and emotions of anger and fear triggered by the online content about the issue of concern.
Although similar measures which explore radicalism often start from the problematic ideological beliefs, the OMS does not include ideological positions on specific policy issues. However, variables indicating belief about the need for economic, political, and social change are included in our measure, because they provide a common motivation for political action.
Further testing of the OMS model is required to test its applicability beyond the sample we surveyed, but potentially it could be replicated in other similar projects with similar target populations.
Illustration 2. Components of the OMS Model
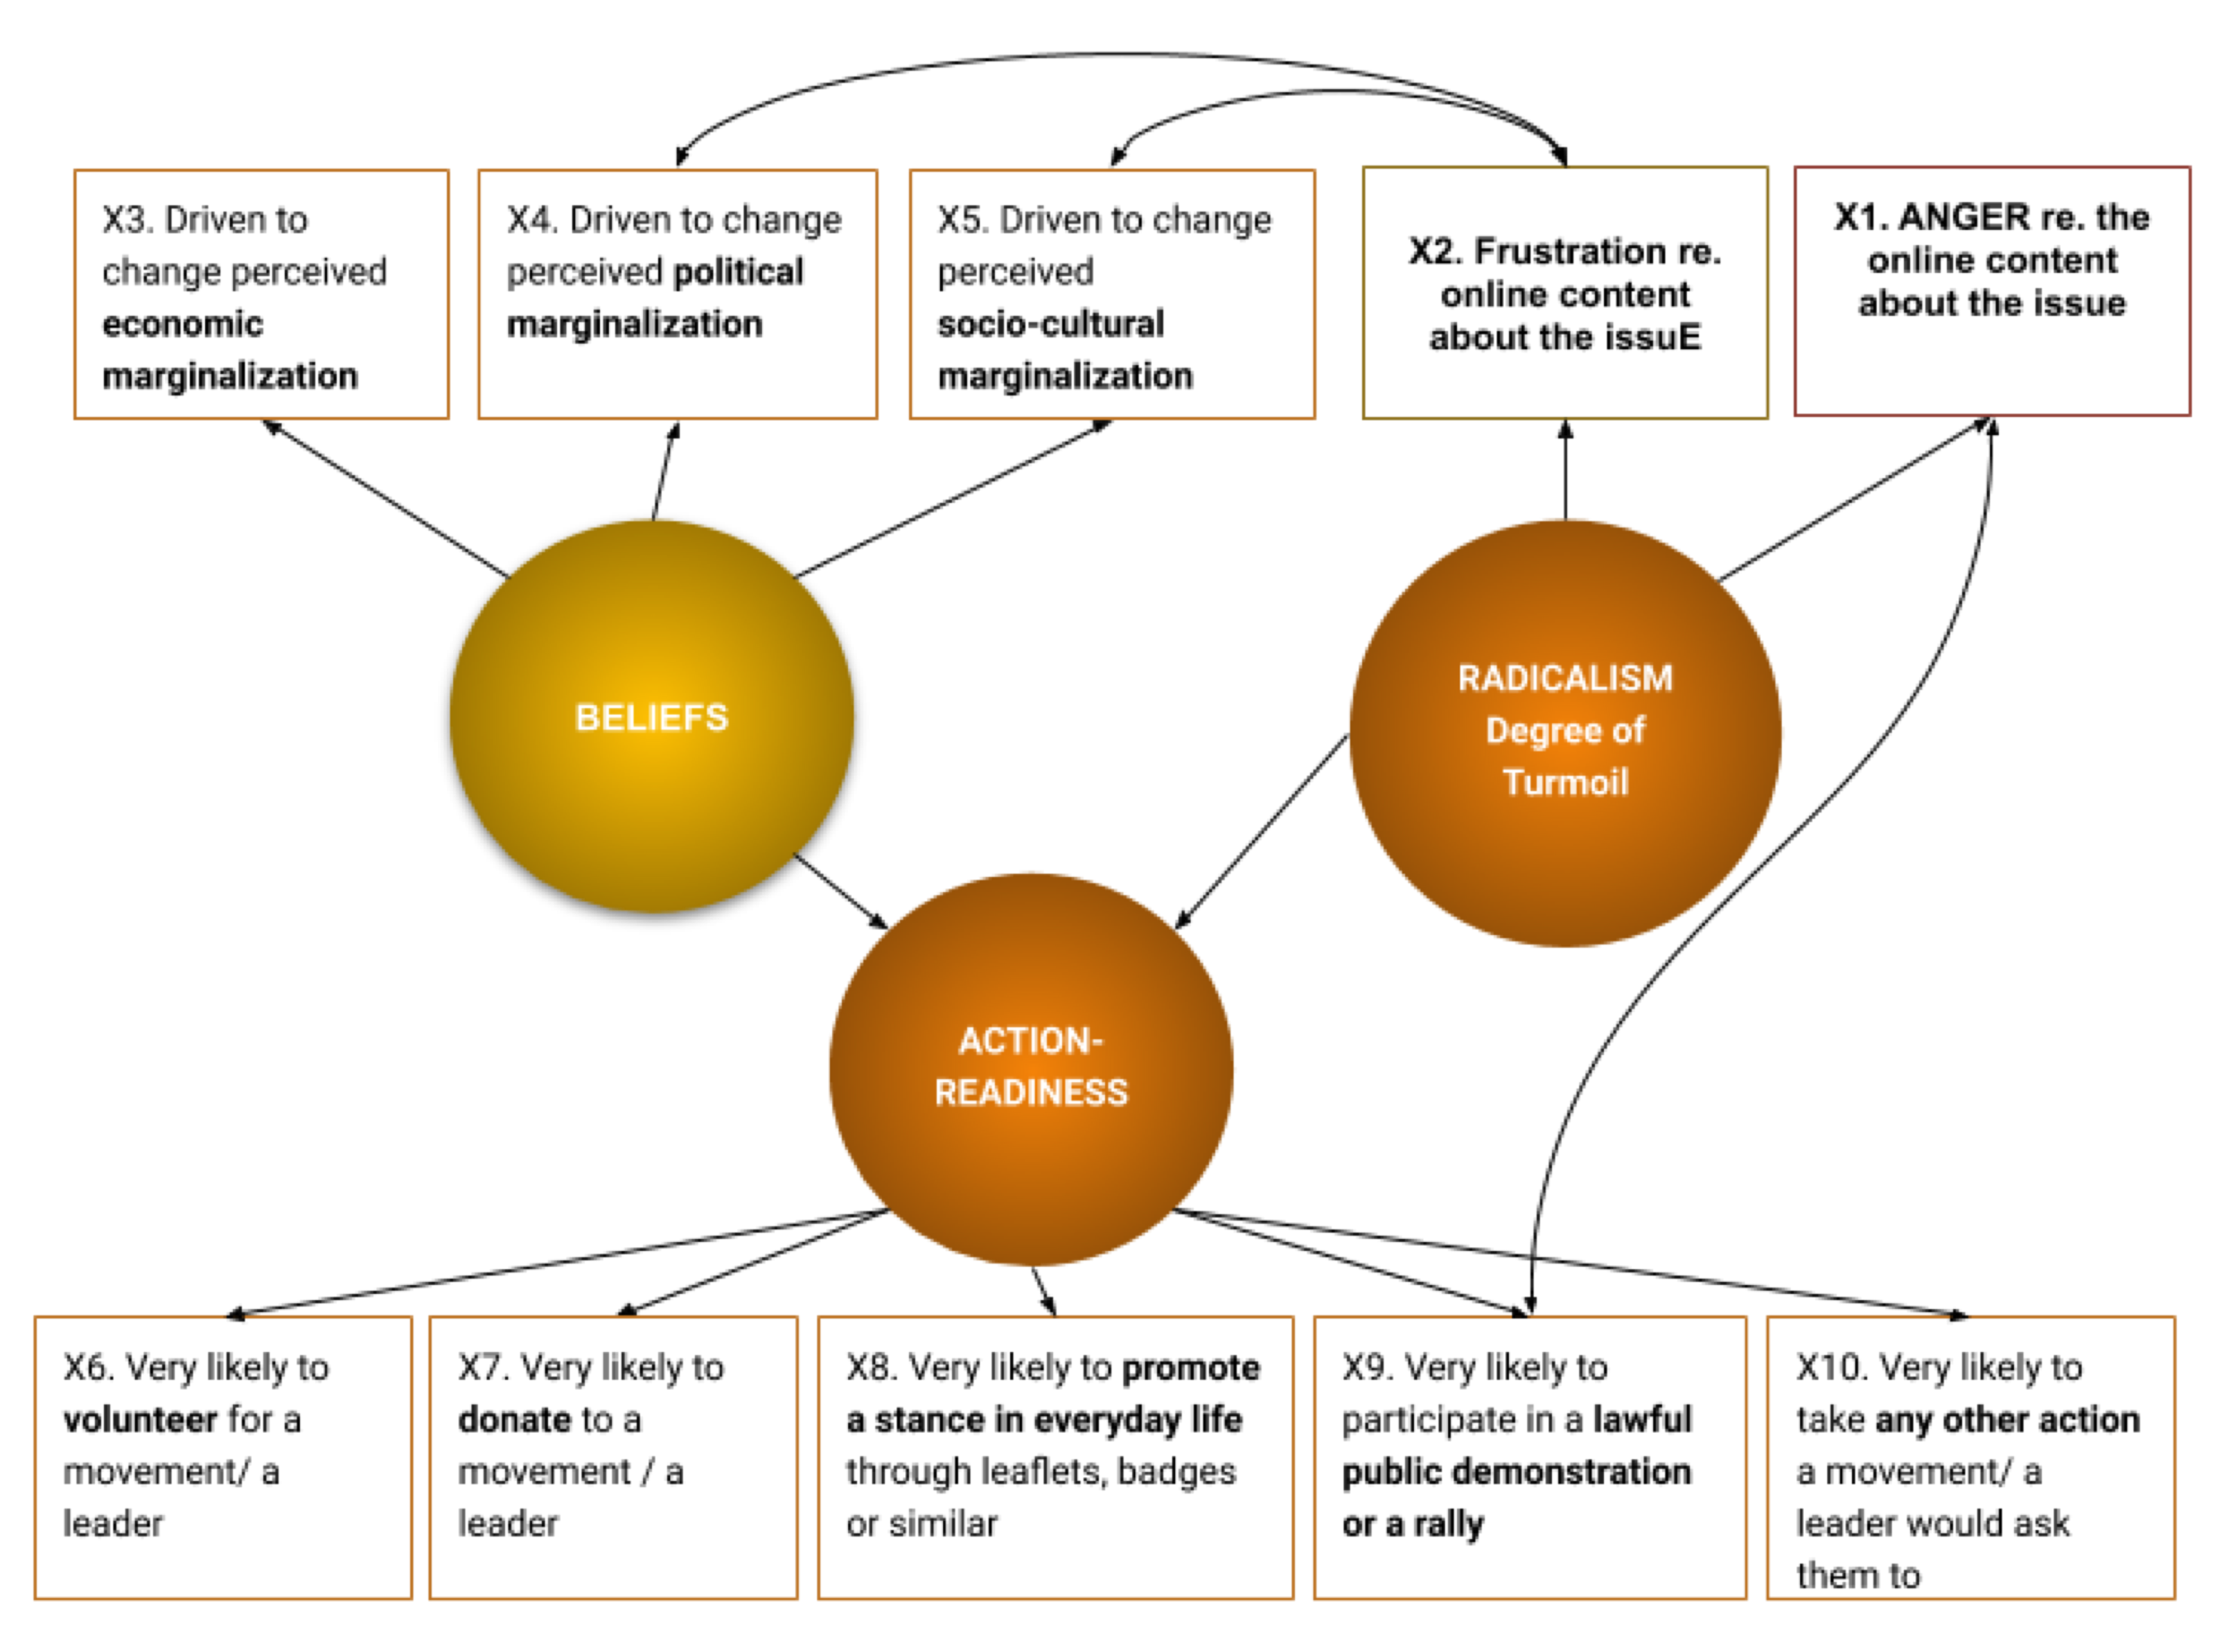
There are several key pieces of information from the model to pay attention to:
- Beliefs about the need for political, socio-cultural, and economic change influence action-readiness directly and the OMS indirectly.
- Action-readiness measured through likelihood of volunteering, donating, promoting a leader or a movement in everyday life, participating in rallies and other political actions significantly overlaps in variation with the OMS.
- The OMS is also directly influenced by anger and frustration the person noted about the online content related to their issue of concern.
- Finally, anger also directly influences the likelihood of participating in rallies, while frustration feeds the drive for political and socio-cultural change.
The factors in the model are based on the survey questions, i.e. signification framework which referred back to the issue of concern the participants noted in the beginning. The table below includes specific questions which were used to develop the model.
Table 2 : Items from the survey instrument used in the model
| Model mark | Question | Response options |
| X1 | Which of the following adjectives below describe how you mostly feel about information you find online in relation to the situation you described in the beginning? Please select all that apply. [Multiple options] | Angry (binary variable) |
| X2 | Frustrated (binary variable) | |
| X3 | Why are you and others concerned about the situation you described at the beginning? Why is it important and what should be done
… in the economic sense? [Dyad] |
People I care about were always poorer, worse off than the rest and this needs to change (continuous variable) |
| X4 | … in the political sense? [Dyad] | People I care about were always marginalized and underrepresented in politics and this needs to change. (continuous variable) |
| X5 | … in the socio-cultural sense? [Dyad] | People I care about are facing difficulties when trying to live by their culture, traditions and values in this country and this needs to change. (continuous variable) |
| X6 | If there was a movement, a political party, or an individual leader with a good solution for the situation that you mentioned at the beginning, how likely are you to do any of the following to help them increase their influence?
… volunteer with that group or individual? [Dyad] |
Very likely (continuous variable) |
| X7 | … donate money to that group or individual? [Dyad] | Very likely (continuous variable) |
| X8 | … promote their stance in everyday life through leaflets, badges or similar? [Dyad] | Very likely (continuous variable) |
| X9 | … take part in their lawful public demonstration or rallies? [Dyad] | Very likely (continuous variable) |
| X10 | … any other action they would ask me to? [Dyad] | Very likely (continuous variable) |
Variables x1 and x2 refer to anger and frustration. The participants were asked to mark how the content they found online about the issue of their concern (not in online journaling, but in general) made them feel.
Variables x3, x4, and x5 refer to the factor of participants’ beliefs that the economic, political, and/or socio-cultural situation in the country needs to change. The end of the dyad which was used in the model referred to a need for change, while the opposite end of the dyad was a statement about the need for preserving the status quo.
Variables x6, x7, x8, x9, and x10 refer to the action-readiness factor. These are five of the original eight items in the activism group that we included in the questionnaire. The remaining three questions (petitioning, voting, and promoting online) did not fit the model, as we saw it, because these are simple political activities which do not require personal engagement. As such, these common political activities are not a sign of heightened political activism.
Mobilisation model development and testing
Confirmatory Factor Analysis (CFA) is based on representing the relationship between one or more variables which were not measured directly (latent) and their indicators observed directly. This approach is suitable for making large datasets interpretable. Relationships between variables can become complex. When regression analysis is included as a way to impose a shift up in the overall directness of relationships, then the CFA becomes a Structural Equation Model (SEM). The structure is defined by the parameters that can be free, fixed, and constrained.
The first order latent model was executed on a broad set of variables related to action-readiness, beliefs, and emotional reactions to online content. The set of questions adapted from the standard measure of activism has been confirmed as a measure for the Action-Readiness latent variable. The analysis continued iteratively, where the perceived need to change the marginalised political, socio-cultural, and economic position are adopted as a measure for the Beliefs latent variable.
CFA of several models of the first order latent variables, bi-factor and second order latent variables has lead us to the SEM, where Beliefs (as a latent variable) have a direct effect on Action-Readiness (latent variable) and an indirect effect on the Mobilisation, through Action-Readiness. In the final model, OMS is a latent variable defined by variation in Action-Readiness and two specific emotional reactions to issue-related online content, anger and frustration.
Mobilisation can be measured by Action-Readiness but feeling angry and frustrated about online content “supercharges” Action-Readiness, increasing the Mobilisation. Mobilisation as a latent variable is defined by loadings that come from anger and frustration which were observed through the questionnaire, and by loading that comes from Action-Readiness as another latent variable. All loadings are larger than 0.3 and highly statistically significant. Finally, the model is robust and has high global, absolute, and relative fit indices.
Procedure
The initial model included the latent variables of Action-Readiness, Beliefs, and Emotions. The one-layer latent approach indicated that there is some structure between Action-Readiness, Beliefs, and Emotions.
A classical second order latent variable model, which includes Action-Readiness, Emotions and Beliefs in the first layer, opened some questions about the effects of Emotion on Mobilisation and on the typical dominance of Mobilisation as a latent variable on the other three latent variables. This clear hierarchy was not the best fit, and we found that Action-Readiness mediates Beliefs to Mobilisation, and that Emotion, especially anger, are triggers that drive Action-Readiness towards Mobilisation.
An observed variable of high likelihood of attending a lawful public demonstration or a rally (Likely to Attend Rally) contributes to Mobilisation. But, the effect in that sense is stronger when observed through Action-Readiness than on its own.
The anger (Angry) is a key trigger for Mobilisation, while frustration (Frustrated) has a more dispersed effect. Although we have included frustration as a manifest variable for Mobilisation, there are modification indices that show the role of this emotion in Beliefs and Action-Readiness. The best overview of the mechanics of emotions is by comparing the two models presented in the results section.
We get a significant improvement of the model (0.25 in relative fit indices) by allowing for:
- Frustration (Frustrated) to covariate with the beliefs about the need for Political Change and Socio-Cultural Change, and
- Anger (Angry) to covariate with likelihood of attending demonstrations and rallies (Likely to Attend Rallies).
Table 3: Data description for variables in the model
| variable | Missing | Complete | N | Mean | StDev | p0 | p25 | p50 | p75 | p100 | |
| X1 | Angry | 0 | 547 | 547 | 0.46 | 0.5 | 0 | 0 | 0 | 1 | 1 |
| X2 | Frustrated | 0 | 547 | 547 | 0.45 | 0.5 | 0 | 0 | 0 | 1 | 1 |
| X3 | Economic Change | 185 | 362 | 547 | 0.42 | 0.32 | 3e-04 | 0.12 | 0.34 | 0.7 | 1 |
| X4 | Political Change | 180 | 367 | 547 | 0.71 | 0.25 | 0.003 | 0.55 | 0.78 | 0.91 | 1 |
| X5 | Socio-Cultural Change | 120 | 427 | 547 | 0.59 | 0.32 | 0.0012 | 0.31 | 0.68 | 0.9 | 1 |
| X6 | Likely to Volunteer | 39 | 508 | 547 | 0.5 | 0.33 | 3e-04 | 0.18 | 0.53 | 0.81 | 1 |
| X7 | Likely to Donate | 41 | 506 | 547 | 0.41 | 0.33 | 3e-04 | 0.09 | 0.35 | 0.7 | 1 |
| X8 | Likely to Promote Offline | 47 | 500 | 547 | 0.46 | 0.32 | 0.00029 | 0.14 | 0.49 | 0.75 | 0.99 |
| X9 | Likely to Attend Rallies | 31 | 516 | 547 | 0.57 | 0.33 | 3e-04 | 0.28 | 0.63 | 0.87 | 1 |
| X10 | Likely to Do Other | 101 | 446 | 547 | 0.37 | 0.31 | 0.00024 | 0.062 | 0.34 | 0.57 | 1 |
The missing values issue was treated with a random forest method. The overall robustness was confirmed on a reduced dataset, but we needed factor scores for Mobilisation for further analysis. Therefore, we applied the random forest as a machine learning technique.
The model
Model illustrated with a path diagram presents an imposed structure.
Belief is a latent variable measured with observed variables Economic Change, Political Change and Socio-Cultural Change.
Action-Readiness as a latent variable is measured with questions adapted from the activism set of items: Likely to Volunteer, Likely to Donate, Likely to Promote Offline, Likely to Attend Rallies, and Likely to Do Other. This set of variables was selected as a result of explanatory and confirmatory analysis, but also it is based on a theoretical understanding of the relationship between activism and mobilisation.
Finally, Mobilisation is a latent variable measured with Action-Readiness as a latent variable, and anger and frustration, the emotion-related variables observed through the survey. We impose that Beliefs have effect on Mobilisation only through Action-Readiness as a mediator.
Results
Illustration 3. Path diagram of the mobilisation model
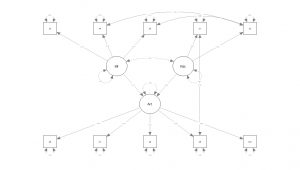
The final model is a result of an iterative process where more than 20 models were analysed. In that process we performed explanatory and confirmatory factor analysis, which allowed us to impose structure as presented in the table below.
Table 4. Results
| PE.lhs | PE.op | PE.rhs | PE.exo | PE.est | PE.se | PE.z | PE.pvalue | PE.std.nox |
| Beliefs | =~ | x3 | 0.00 | 0.11 | 0.02 | 7.26 | 0.00 | 0.35 |
| Beliefs | =~ | x4 | 0.00 | 0.17 | 0.02 | 10.66 | 0.00 | 0.65 |
| Beliefs | =~ | x5 | 0.00 | 0.26 | 0.02 | 11.83 | 0.00 | 0.82 |
| Activism | =~ | x6 | 0.00 | 0.25 | 0.01 | 18.01 | 0.00 | 0.84 |
| Activism | =~ | x7 | 0.00 | 0.21 | 0.01 | 15.04 | 0.00 | 0.69 |
| Activism | =~ | x8 | 0.00 | 0.22 | 0.01 | 15.81 | 0.00 | 0.73 |
| Activism | =~ | x9 | 0.00 | 0.21 | 0.01 | 15.48 | 0.00 | 0.69 |
| Activism | =~ | x10 | 0.00 | 0.23 | 0.01 | 17.29 | 0.00 | 0.80 |
| Activism | ~ | Beliefs | 0.00 | 0.19 | 0.06 | 3.21 | 0.00 | 0.17 |
| Radicalism | =~ | Activism | 0.00 | 0.37 | 0.11 | 3.45 | 0.00 | 0.35 |
| Radicalism | =~ | x1 | 0.00 | 0.23 | 0.05 | 4.21 | 0.00 | 0.46 |
| Radicalism | =~ | x2 | 0.00 | 0.18 | 0.05 | 3.95 | 0.00 | 0.36 |
The direct relationship between Action-Readiness and Beliefs was imposed and the Beta coefficient is large and significant. All loadings in the CFA part of the model are above 0.3 and significant.
The mechanics of emotion is elegantly defined by improvement between models presented in the next table.
Table 5. Improvement between models
| Model | X2 | df | CFI | RMSEA | SRMR |
| Model 1 | 96.037 | 33 | 0.959 | 0.059 | 0.05 |
| Model 2 | 51.057 | 30 | 0.986 | 0.036 | 0.033 |
Action-Readiness, anger and frustration are indicators of Mobilisation. The likelihood of participating in public demonstrations or rallies is one of the indicators of Action-Readiness, and the perceived need for political and socio-cultural change are indicators of the Beliefs factor.
Although there is an indirect relationship between frustration about online content and the perceived need for political and socio-cultural change, and an indirect relationship between anger about online content and the likelihood of participating in demonstrations, the model improves significantly if we put more ‘directness’ in those relationships by allowing them to covariate. In the diagram, this covariance is presented as double-headed arrows between those variables. This decision is supported by high residual covariance between those observed variables in the model.
Further, frustration is positively associated with the perceived need for change in the political and socio-cultural situation, but not in the economic situation. This may be a reflection of the sampling procedure since most participants live in large urban areas with a high average income, and the share of highly educated persons in the sample is very high. Economic problems, although salient in the narratives, may also be more connected to other emotions, which will be explored in the next stages of research.
About Resonant Voices Research
The Resonant Voices Initiative in the EU (RVI EU) counters dangerous online narratives. In order to deliver on its purpose, as well as to facilitate learning inside and outside of the project, the RVI EU engaged in research using different methods guided by the following research questions:
- Which narratives currently have the strongest mobilising power among Western Balkans diasporas in Austria and Germany, as well as among the general population in Croatia?
- Which categories (audience segments) in the selected communities are the most and the least sensitive to these narratives?
- Which individual, community, and contextual characteristics contribute to mobilisation around these narratives?
- What is the relationship between online mobilisation and online radicalisation?
- Which strategies are effective to counter narratives promoting hate, and/or violence?
Micro-narratives survey
The micro-narratives survey explores concerns, preferences, experiences, and demographic characteristics of participants from the former Yugoslavia diaspora communities. The survey is designed as a panel study, with the baseline data collected in the second half of 2019, and the endline data collection to take place in June 2020, measuring the effect of a strategic communication campaign implemented by the Resonant Voices Initiative. In Croatia, the field researchers in 2019 targeted mostly the general population, but 10 % of the sample included minorities and immigrants from other countries of the former Yugoslavia. In Austria and Germany, the sample included predominantly the population of immigrants from the former Yugoslavia and included around 10% of the general population. This chapter provides further details on the sample, the data collection, and data analysis.
Sampling approach and data
The micro-narratives survey was designed as a panel survey with the same participants in the baseline and endline data collection cycle, selected using controlled quota sampling. Up to 240 participants were to be recruited for the panel in Austria, Croatia, and Germany. Out of that number, 120 panel participants were projected in the project’s target locations (Vienna, Zagreb, Berlin), with an additional 120 outside the target locations in each country.
We opted for the controlled quota sampling because the population of the Western Balkans immigrants in Austria and Germany is not easily accessible via probability sampling and would require significantly more resources than available to RVI currently.
Quotas for Austria and Germany were based on the limited official statistics about Western Balkans immigrants. Field researchers targeted Western Balkans immigrants with a specific country background from the former Yugoslavia based on immigration statistics, as well as 10 percent of the sample with a non-immigrant background. In Croatia, the majority population was targeted, as well as 10 percent of the sample with minority ethnic background.
In all three countries, the quotas are reflected sex and age, based on immigration statistics and census data.
Our panel recruitment and data collection in the baseline study relied on the team of 15 field researchers in the three countries. The field researchers conducted respondent recruitment and outreach through their own individual contacts and through different community organisations, especially in Austria and Germany.
Figure 36 shows the map locations where participants were surveyed, as well as their countries of birth, sex, and age in the table.
Figure 36. Participants by countries, sex, and age
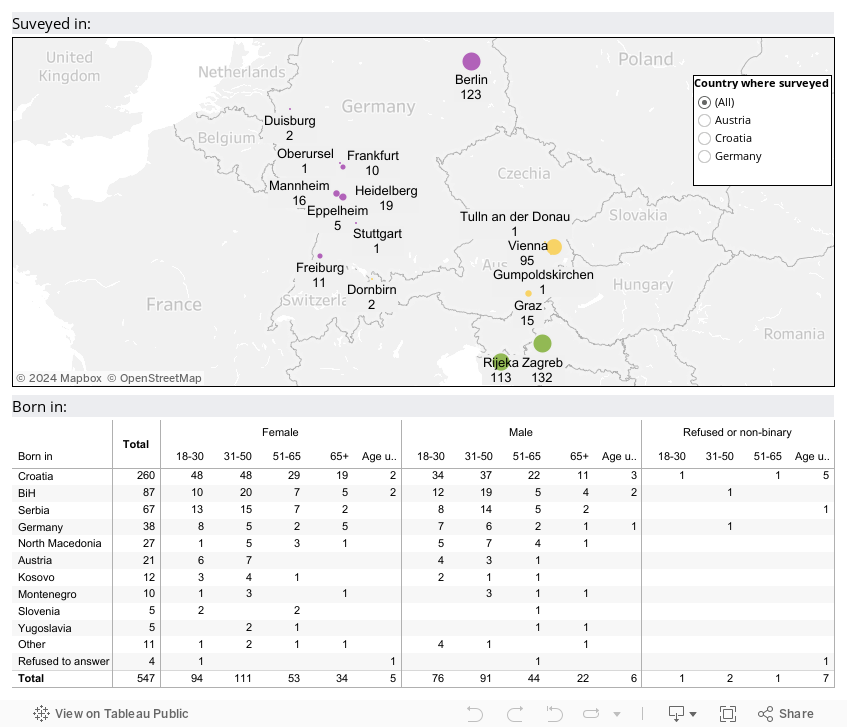
The baseline data collection lasted between 24 June and 4 August 2019 in Austria, Croatia, and Germany, and it was repeated in Germany between 20 September and 20 October 2019.
In the baseline study, we surveyed:
- 112 participants in Austria (95 in Vienna and 17 outside Vienna)
- 245 participants in Croatia (132 in Zagreb and 113 in Rijeka)
- 190 participants in Germany (123 in Berlin and 67 outside Berlin)
The ethnic breakdown is shown in Figure 37. The question on ethnicity in the survey instrument was a multiple-choice type, where different nationalities (e.g. Bosnian) and ethnicities (e.g. Bosniak) were listed and participants were asked to mark all those they identify with, while they could have also entered another option.
Figure 37. Sample by ethnicity and country of data collection
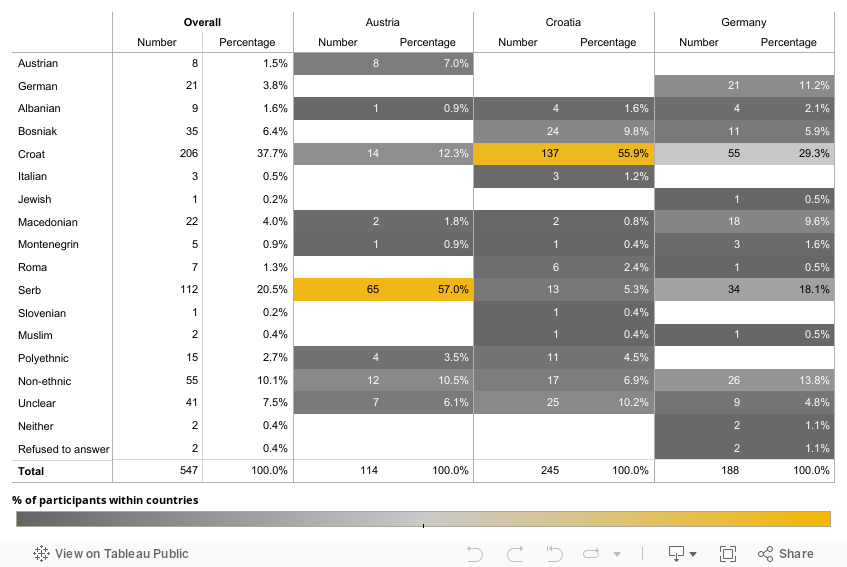
Within the sample in Austria, 7 percent identified only as Austrian, in Croatia 56 percent identified only as Croat, and in Germany 11 percent identified only as German.
The largest group by ethnicity in our sample in Austria are Serbs (57 percent) followed by Croats (12 percent). The largest group in Croatia are Croats (56 percent) followed by Bosniaks (10 percent). In Germany, Croats are the largest group in the sample (29 percent), followed by Serbs (18 percent).
Around 4 percent in Austria and Croatia identified in polyethnic, rather than in monoethnic terms, e.g. marking both Serb and Bosniak. At least 7 percent in each country identified in non-ethnic terms, e.g. Bosnian, Yugoslav, etc., with the highest percentage in Germany.
Instrument and process
The instrument consisted of 102 questions in the following groups:
- Opening question asking participants to describe a recent situation (micro-narrative)
- Interpretation questions about the situation they described (how worried they are, who they blame, how they assess the influence of different stakeholders on the problem, how common this concern is, and why they care about it)
- Participants’ political leanings, preferences on politically sensitive issues, and likelihood of political activism
- Participants’ exposure to radical movements through friends and family, TV channels, and online sources which spread dangerous narratives
- Media usage and habits relating to TV, online sources, social media, and social messaging services, their capacities to assess truthfulness of information online, and emotion which online sources trigger
- Spatial considerations, including country and city attachments, as well as neighbourhood diversity and safety;
- Life experiences, including exposure to violence and poverty, migration and integration experiences
- Identity questions, such as nationality and ethnicity, religion and religiousness, language and feeling as a minority
- Demographic questions, including sex, age, employment status, and wealth self-assessment, country and city of residence
Most of the questions in the survey referred back to the situation the participants described in the opening question, thereby enabling participants to give meaning (significance) to their narrative within the signification framework provided by the survey instrument. This signification framework is more flexible than typical surveys because of the type of questions, and yet less flexible than interviews.
The types of questions included open-ended, multiple-choice, single option questions, dyads and triads. The latter two require a short explanation. A dyad question asks participants to position their response on a line between two options which may but do not need to be opposites. A triad includes three options in the corners of a triangle, where each position within a triangle is a possible answer, enabling fine-tuning of participants’ preferences.
Figure 38. Examples of dyad and triad questions
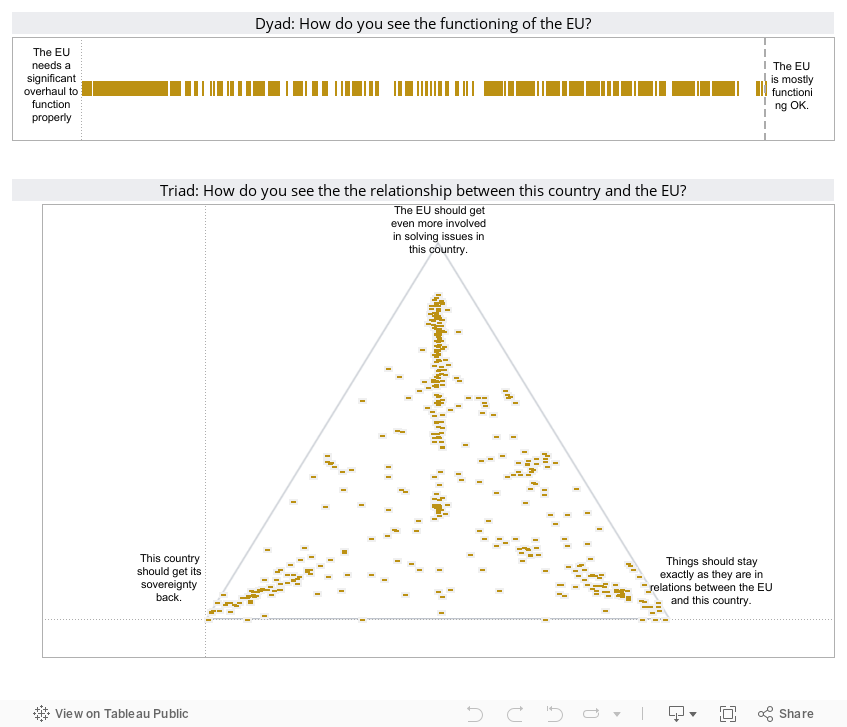
Dyads and triads are a technique developed by Cognitive Edge, along with the SenseMaker software which was used for data collection and analysis in this survey.
The field researchers were able to choose from different ways to administer the survey, including paper-and-pencil, computer assisted, and online computer-assisted surveying. In the beginning of a session, field researchers provided examples of the types of questions included in the instrument, and an explanation about the micro-narratives participants are asked to share.
Data analysis
The panel survey results were analysed using two methods.
The first method included statistical analysis using structural equation modelling (SEM) and statistical correlations. SEM was employed to develop an online mobilisation model which can capture the narratives that have the strongest mobilising power among the Western Balkans diasporas (research question 1). Next, the statistical analysis continued with exploration of statistical correlations to capture factors which contribute to a high Online Mobilisation Score.
The second analytical method was inductive frame analysis of the narratives, complemented with quantitative description of the framing identified. In the process of frame analysis, the following questions emerged from the first readings of the narratives:
- Which topic and theme are significant for the individual participant?
- How is intensity conveyed in the narrative (emotion, description of violence, etc.)?
- Which dichotomies of power are used in the narrative (us vs. them, rich vs. poor, etc.)?
- Which topics and themes are salient across participant groups?
In the final analytical step, the identified topics and themes were categorized into frames, and quantitative description of the signification framework questions was visualised per key.
In this first instance, our focus in the analysis was on migration, while the frame analysis will continue with new themes.
Caveats
Our target population, the Western Balkans immigrants in the Austrian and German context are a hard-to-reach group, and we employed non-probability quota sampling to reach the target population. Consequently, the model we developed and tested is rigorous within our dataset, and the statistical correlations suggest that there are contextual factors which influence the Online Mobilisation Score, but these findings cannot be generalised to the entire population of the adult Western Balkans diasporas in Austria and Germany or to the entire adult population in Croatia.
In relation to the frame analysis, the interpretation of narratives can significantly vary between different analysts, which is often inherent in any qualitative analysis.
Summary
The micro-narratives survey is designed as a panel survey with the same participants in the baseline and endline study. The baseline study data was collected in the period from 24 June and 4 August 2019 in Austria, Croatia, and Germany, with a repeated cycle in Germany between 20 September and 20 October 2019. A total of 547 participants were surveyed in the baseline cycle, most of them in the project’s primary locations (Vienna, Zagreb, and Berlin), as well as in other smaller locations in Austria, Croatia, and Germany. The quota sampling targeted Western Balkans diasporas by country background in Austria and Germany, and ethnic majority and minority population in Croatia. Other quota criteria included sex and age. The study relied on field researchers’ contacts with diaspora and community organizations.
The main survey questionnaire included 102 questions in nine groups, starting with the opening question which asked participants to describe a recent situation that had made them feel uneasy, happening in or outside the country. The remaining questions explored the significance and salience of the narratives in a signification framework, as well as demographic questions, life experiences, and communication and media questions which did not refer back to the situation the participant described at the beginning. The study used the Cognitive Edge’s SenseMaker software and the signification framework approach with the types of questions usually used.
Structural equation modelling was used in order to analyse the data and develop a model of online mobilisation, which was later used to identify narratives with the strongest mobilising potential in the sample. The statistical analysis continued with statistical correlations to identify other variables which contribute to mobilisation. The qualitative part of the study included the frame analysis of micro-narratives complemented with quantitative description of the identified key frames and signification questions. This report presents findings and conclusions of the qualitative analysis for the migration theme, while similar analyses will continue for other salient issues in the sample.